Short Answer: With the new Healthcare.gov number just released for enrollments through 12/24, we can now estimate that ~160,000 individuals enrolled on 12/23 (!!!) (through both the state and federal exchanges), nearly twice the rate of the preceding days. That's because ~210,000 enrolled on 12/23 and 12/24 via Healthcare.gov, bringing up the total enrollment through the federal site to ~1.1 million and the nationwide enrollment to ~2 million. In the four days (12/19-12/22) leading to the big enrollment deadline (i.e., the deadline to sign-up for health insurance in time for coverage on January 1st), the enrollment rate was ~85,000/day. To put that in perspective, in October a paltry 4,200/day were enrolling. November fared only a little bit better at ~10,000/day.
If you want a more detailed explanation for why these numbers matter and how I calculated them, read below the fold.
Back story: My friend and I have gotten tired and annoyed by the vapid and circular media coverage of the Affordable Care Act (aka Obamacare). So in an effort to combat the lazy media coverage (and inspired by the work done by brainwrap and others here at DailyKos), we decided to make a blog for the benefit of our friends that would take an analytical approach to cut through the noise. Some things that are of interest to us, include quantifying how much better are the exchanges today than in October/November and if there is there any hope of reaching that magical 7 million enrollment target. One way to do that determine the daily enrollment rate. We figure that the reality-based community here at Dailykos would also appreciate to see these numbers, so without further ado, here are the numbers and how we got them!
Long Answer: We all know October was terrible for Healthcare.gov. Very few Americans successfully enrolled in insurance plans due to lots of glitches. November was essentially sacrificed by the White House to fix the website rather than sign folks up. Now, it's December. By all accounts, both the federally-facilitated (FFMs) and state-based marketplaces (SBMs) are significantly improved (for the most part) - seeing heavy loads and boasting significantly higher enrollment numbers than between October and November. But, has it been enough to reach the oh-so magical "7 million enrollments" target for success? Last week we documented the December surge, now it's time to delve a little deeper into the numbers.
Given the history of the roll out and the reported surge of enrollments, I was interested in determining the approximate number of people enrolling each day. This has been a bit of an arduous task because of the haphazard nature of how the enrollment data has been publicized. For that reason, I want to emphasize that the graphs below are estimates and are limited by the quality, quantity, and accuracy of the enrollment data that has been publicized. In this regard, I give a ton of credit and appreciation to the work by Brainwrap and others at acasignups.net (and of course here at Dailykos!) who have meticulously documented the enrollment for the 50 states and DC from the beginning, even as many other groups have failed to keep-up with the deluge. Thanks to their work, I have been able to compile enrollment numbers in parallel.
Since I could compile an enrollment history for each state (and via updates from the Administration, the federal exchange as a whole), I've been able to make an estimate (guestimate?) of the number of people who enroll daily. We calculated this number the simplest way possible - a linear interpolation between enrollment reports. For example, if 7,000 individuals enrolled between 10/1-10/7 and 14,000 enrolled between 10/8-10/14, then we would input it as 1,000 enrollments/day and 2,000 enrollments/day respectively. Of course, this is not a true measure of the enrollments rate. In our hypothetical scenario, there might have been a server outage on one of the days resulting in significantly fewer enrollments on that day (and correspondingly more on other days). Also, this model disregards "ramping up" trends and introduces discontinuous jumps in the enrollment rate (e.g., from 1,000 [10/7] to 2,000 [10/8]). A linear interpolation assumes the least, but will result in flat curves between enrollment reports and discontinuous jumps corresponding to new enrollment data. A more "accurate" model, such as a quadratic interpolation, would help solve the latter problems, but not the former. However, our purpose is not to figure out exactly how many people enrolled on a given day, but to observe general trends.
Alright. Caveats aside, let's see those enrollment numbers!
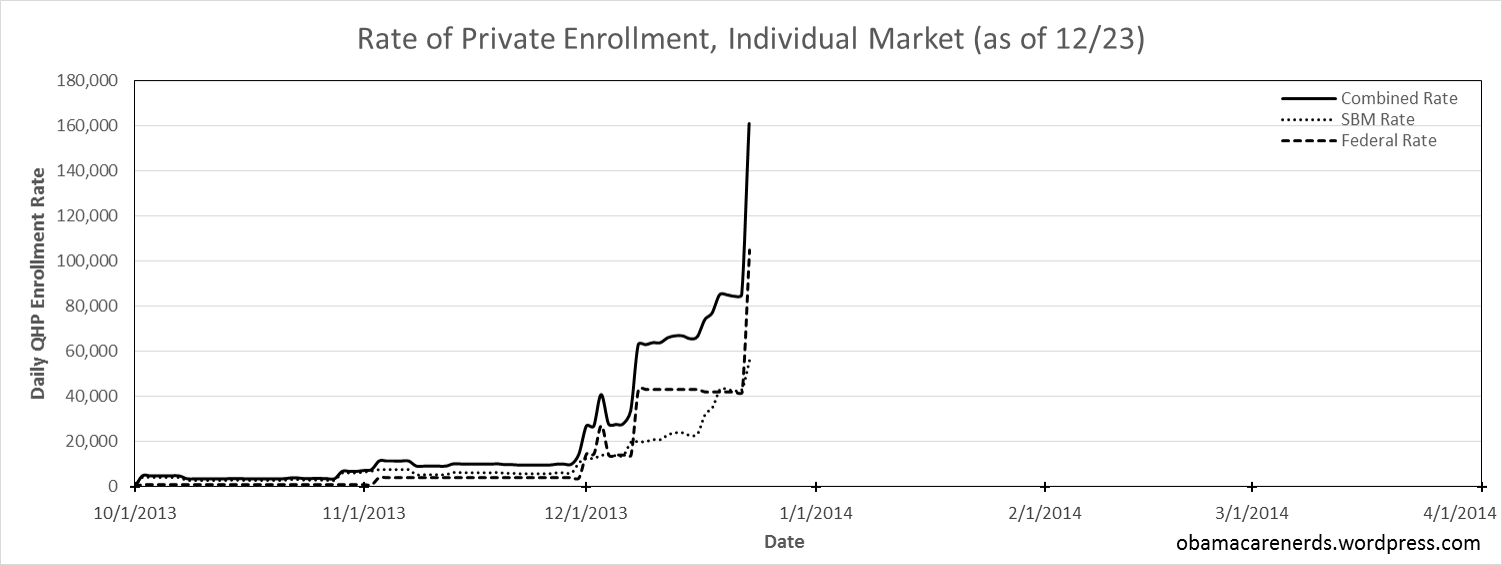
In the four days leading up to the Dec. 23rd deadline, the enrollment rate was staggeringly more than in the past. This is true for both the state and federal marketplaces. A combined 85,000 individuals were enrolling per day, split evenly between FFMs and SBMs. And then we see the massive spike representing the enrollment on 12/23! Perhaps surprisingly, the enrollment in the state-based exchanges ramped up significantly in December as well, even though these marketplaces were working far better in October and November than the federal exchanges.
This gives some credence to the theories that:
(1) the state-based exchanges, while generally better than the federal exchange, have also improved;
(2) the bad publicity and woes for the federal marketplace significantly dampened the enrollment on the state-based exchanges;
(3) the ramp up of advertisements from private health insurers and state/ federal officials in December influenced enrollment;
(4) we are a nation of procrastinators.
The comparatively lower enrollment of SBMs in early December does suggest FFMs observed some "pent-up demand" - people who would have enrolled in October and November if healthcare.gov was working properly.
So how do these number compare to earlier trends? Well, for the federal exchange, the enrollment leading up to the deadline was 50 times that in October (!!), 11 times that in November, and 2.5 times that in the first week of December. For the state exchanges, the current rate of enrollment is 14 times that of October, 7 times that of November, and 3 times that of the first week of December (see the table for more details). And of course, on the "deadline" itself, ~160,000 individuals enrolled!
| Date |
FFM |
SBM |
Total |
| October |
837 |
3,365 |
4,202 |
| November |
3,736 |
6,320 |
10,056 |
| December 1-7 |
16,000 |
14,334 |
30,334 |
| December 8-18 |
42,883 |
24,179 |
67,062 |
| December 19-22 |
42,000 |
43,049 |
85,049 |
| December 23 |
105,00 |
56,157 |
161,157 |
If you were one of those kids who was super awesome at calculus, you may have noticed this surprising fact: sometime around 12/15, the federal marketplace had enrolled more total individuals (~590,000) than the state-based marketplaces (~570,000). As of 12/24, the federal marketplace has enrolled 1,100,000 and the state-based marketplaces have enrolled 885,000. And for those of you who can't tabulate the area under the curve by sight, fear not! Below, is the total enrollment.

This figure is fairly similar to the one done by acasignups.net, but a little smoother because of our linear interpolation method. The enrollment, thus far, has been exponential. As of 12/24, >2 million Americans had enrolled. Of course, this is just for private health insurance selected through the marketplaces. It is unclear how many people purchased their plans directly from the insurer (people who do this are not eligible for the subsidies). Also not included are the approximately 4 million individuals who will gain coverage through Medicaid/SCHIP. A significant number are also likely to enroll through the marketplace's small business exchanges (SHOP).
So...is Obamacare on track to meet it's enrollment target in March?
Unfortunately, the media is less interested in the number of actual people helped or the nuances of the law than they are about this mythical 7 million enrollment number (which, in case you were wondering, was an estimate made by the CBO (PDF) for the number of people enrolling in private health insurance through the marketplaces by the end of 2014).
Fairly or unfairly, the law will be judged by whether the Administration hits the 7 million mark. With that in mind, is there any hope to reach the mark given the glitches and errors the marketplaces had and still have? It's hard to tell because enrollment is not linear. It will surge before major enrollment deadlines (like the recent cut-off for coverage by January 1st), and be relatively calm otherwise (like October and November would have been even if healthcare.gov was fully functional, as we can glean from the state-based exchanges). That being said, the enrollment rate in December suggests that meeting the 7 million mark is not out of the realm of question.
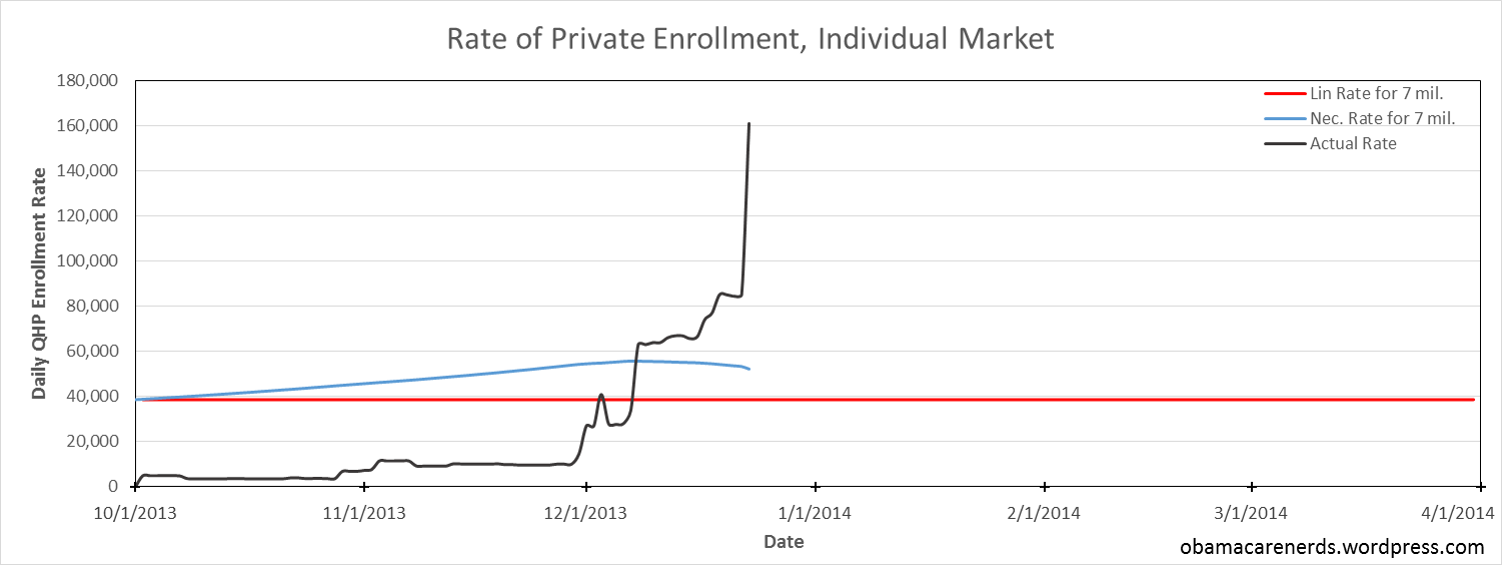
If there was a linear rate of enrollment, in order to reach the 7 million target, about 38,500 individuals would have enroll each day during the open enrollment period (red line). With the slow October and November enrollment, the necessary enrollment rate for the remainder of the enrollment period (blue line) crept up to 55,500 a day at one point. Since early December, this number has declined as the actual enrollment rate has been higher the required rate (now at ~52,000). Of course, we should expect the enrollment rate to decline post-deadline, as the December enrollment (to get coverage for January) and the March enrollment (to get coverage before the end of the open enrollment period) are likely to be biggest enrollment months. But if we continue to see enrollment rates that persist between 30,000-50,000 during the "lull" periods (e.g., December 25-January 7 before the January 15th deadline to enroll), then hitting 7 million enrollments is not outside the realm of possibilities - a testament to how far the exchanges have come since October 1st.
Here’s the link to the data used to derive those graphs.
Finally, I would like to give a h/t to our own Brainwrap, ArcticStone, etc. Their efforts have made this diary possible! Major kudos!
--
Full disclosure, an earlier version of this diary was posted here. This version has updated graphs and discussion of data, but if you are interested to see what they looked like before the new federal updates, I encourage you to check out that post.
