This diary continues a series that envisions a House of Representatives elected in a similar manner to the House of Commons in Canada. Representatives are elected from ridings with an average size of 110,000 (similar to Canada), that bear names instead of numbers. These ridings tend to follow communities of interest much more than our House districts do, so all maps in this series will be commission-style COI maps. Apportionment will be according to US rules, but with 2807 ridings to be divided between the 50 states and DC (I regard DC disenfranchisement as shameful). I am using the VRA, but not to the extent of gross violations of COI or compactness. All else being equal, I will maximize the number of competitive ridings.
In my previous diary, I included a poll of which state to diary next. Out of seven options, most of which I thought would be at least moderately appealing, New York won by an overwhelming margin over all other states and, thankfully, the "why bother?" option. So here we go.
New York State gets a whopping 176 ridings, more than half the size of the entire Canadian House of Commons. For logistical reasons, I would rather not describe 176 ridings in a single diary, so I will instead do a three-part series for New York State. Part I, namely this diary, covers Long Island and its 26 ridings. Part II covers the five boroughs of New York City, which are allotted 74 ridings, one more than all of Virginia. Part III covers mainland New York north of the Bronx, but will be referred to as "Upstate" for the sake of simplicity unless a better name is suggested.
Disclaimers:
1. I have never lived in New York State and am not very familiar with the communities of interest. These ridings represent my best attempt at a COI map, but I am happy to take constructive criticism on the matter. In addition, any pointers regarding COI in NYC or upstate New York would also be welcome.
2. This series is designed to be a neutral analysis of what would happen with smaller, less gerrymandered House districts. While debate over the desirability of smaller districts is welcome in this diary, I am not taking a position on the matter.
3. The only changes envisioned by this diary series are to the nature of the districts that Representatives are elected from, plus the enfranchisment of DC. While again I will not discourage any discussion that may arise from this diary, I am not envisioning the wholesale adoption of the Canadian political system.
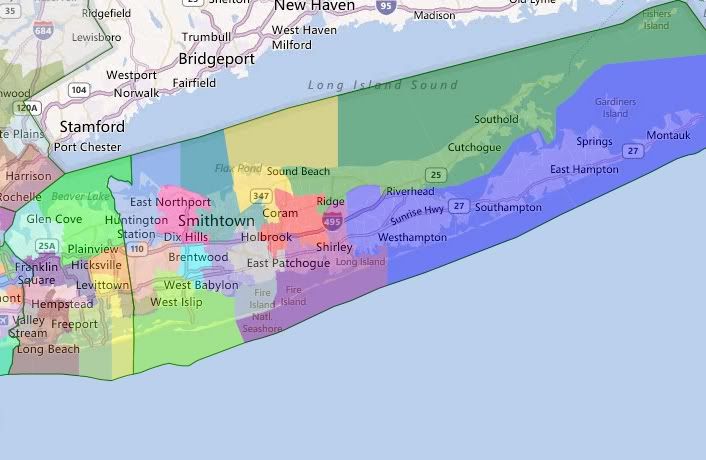
Islandwide View
Hamptons (Blue)
Population: 76.9% White, 16.2% Hispanic, Deviation -161
Political: 56.2% Obama, 57.3% Dem, D+4, Lean D
The small window width cut off Montauk Point, but this district goes all the way out the south prong. Tim Bishop (D-NY-01) lives here, and gets a considerable improvement to his district.
Southold-Riverhead (Green)
Population: 86.0% White, 8.2% Hispanic, Deviation +287
Political: 49.1% Obama, 52.6% Dem, R+2, Swing
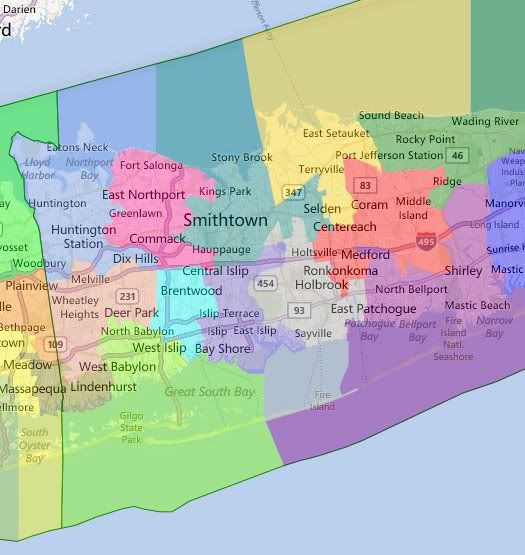
Western Suffolk County
Mastic-Bellport (Dark Magenta)
Population: 73.5% White, 6.9% Black, 15.7% Hispanic, Deviation -3
Political: 55.6% Obama, 55.3% Dem, D+3, Lean D
Coram-Yaphank (Red)
Population: 75.2% White, 7.5% Black, 12.0% Hispanic, Deviation -784
Political: 54.6% Obama, 56.7% Dem, D+3, Lean D
Port Jefferson-Selden (Gold)
Population: 80.6% White, 8.1% Hispanic, 7.1% Asian, Deviation -319
Political: 53.9% Obama, 56.7% Dem, D+2, Swing
Smithtown-Centerreach (Teal)
Population: 86.9% White, 6.2% Hispanic, Deviation +577
Political: 44.6% Obama, 47.5% Dem, R+7, Likely R
Ronkonkoma-Holbrook (Dark Gray)
Population: 85.2% White, 9.3% Hispanic, Deviation +760
Political: 48.5% Obama, 52.0% Dem, R+3, Lean R
Islip (Slate Blue)
Population: 64.9% White, 8.9% Black, 22.2% Hispanic, Deviation -446
Political: 53.2% Obama, 55.7% Dem, D+4, Lean D
Brentwood (Cyan)
Population: 26.7% White, 14.6% Black, 54.3% Hispanic, Deviation +284
Political: 73.8% Obama, 74.2% Dem, D+21, Safe D
Northport-Elwood (Deep Pink)
Population: 88.7% White, Deviation -793
Political: 46.9% Obama, 49.7% Dem, R+5, Likely R
Deer Park-Babylon (Chartreuse)
Population: 80.7% White, 7.0% Black, 8.7% Hispanic, Deviation -61
Political: 50.1% Obama, 52.3% Dem, R+2, Swing
Huntington (Cornflower Blue)
Population: 75.3% White, 5.5% Black, 14.2% Hispanic, Deviation -490
Political: 54.7% Obama, 54.3% Dem, D+2, Swing
DCCC Chair Steve Israel (D-NY-02) lives here. He should be fine, as he was already in a less than safe district.
Babylon-Bay Shore (Dark Salmon)
Population: 59.6% White, 19.2% Black, 13.7% Hispanic, 5.7% Asian, Deviation -625
Political: 61.4% Obama, 63.1% Dem, D+9, Safe D
Massepequa-Lindenhurst (Olive)
Population: 78.3% White, 6.2% Black, 12.5% Hispanic, Deviation +163
Political: 46.8% Obama, 48.6% Dem, R+5, Likely R
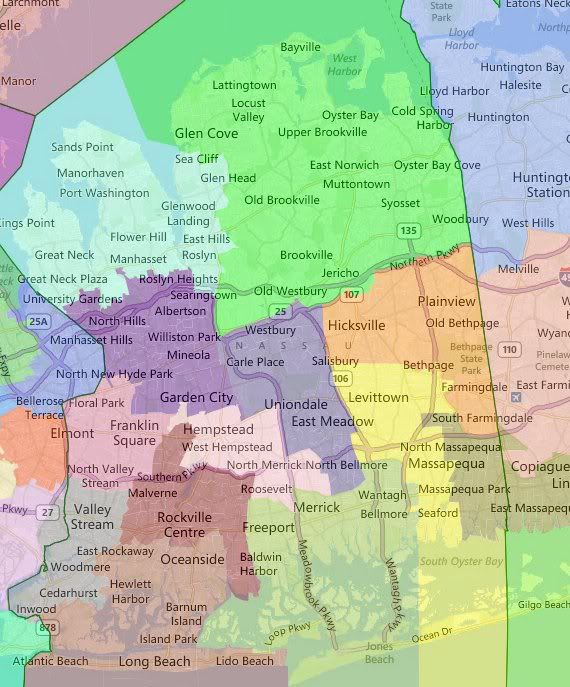
Nassau County
Hicksville-Farmingdale (Dark Orange)
Population: 77.3% White, 8.7% Hispanic, 11.8% Asian, Deviation -137
Political: 51.0% Obama, 54.2% Dem, EVEN, Swing
Brooksville-Oyster Bay (Lime)
Population: 74.3% White, 10.3% Hispanic, 10.7% Asian, Deviation +570
Political: 52.7% Obama, 52.2% Dem, EVEN, Swing
Uniondale-East Meadow (Dark Slate Blue)
Population: 63.2% White, 11.0% Black, 16.7% Hispanic, 7.8% Asian, Deviation -477
Political: 57.4% Obama, 59.7% Dem, D+6, Likely D
Levittown-Seaford (Yellow)
Population: 87.1% White, 7.6% Hispanic, Deviation +26
Political: 42.8% Obama, 45.2% Dem, R+9, Safe R
This riding is the home of Peter King (R-NY-03), a Republican in both the Irish and American senses of the word. He’ll be completely safe here.
Wantagh-Freeport (Yellow Green)
Population: 66.3% White, 12.2% Black, 18.1% Hispanic, Deviation +876
Political: 56.4% Obama, 58.2% Dem, D+4, Lean D
Hempstead-Merrick (Pink)
Population: 18.4% White, 43.2% Black, 34.5% Hispanic, Deviation -70
Political: 83.3% Obama, 81.9% Dem, D+30, Safe D
Rockville Centre (Maroon)
Population: 66.2% White, 15.4% Black, 13.0% Hispanic, Deviation +338
Political: 55.4% Obama, 56.0% Dem, D+3, Lean D
Oceanside-Long Beach (Sienna)
Population: 84.2% White, 9.7% Hispanic, Deviation +336
Political: 51.7% Obama, 54.5% Dem, EVEN, Swing
Roslyn-Kings Point (Aquamarine)
Population: 78.7% White, 8.4% Hispanic, 9.3% Asian, Deviation -345
Political: 56.6% Obama, 58.4% Dem, D+5, Likely D
Mineola-Garden City (Indigo)
Population: 70.8% White, 7.5% Hispanic, 18.0% Asian, Deviation -366
Political: 47.4% Obama, 49.5% Dem, R+4, Lean R
Carolyn McCarthy (D-NY-04) lives here, but she’d move to one of the southern Nassau County ridings, perhaps Franklin Square or Valley Stream-Cedarhurst. She probably couldn’t hold this riding.
Gary Ackerman (D-NY-05) also lives here, and he’d move to Roslyn-Kings Point or one of the northern Queens ridings.
Franklin Square (Pale Violet Red)
Population: 53.7% White, 19.8% Black, 14.0% Hispanic, 10.3% Asian, Deviation +317
Political: 56.1% Obama, 56.1% Dem, D+3, Lean D
Valley Stream-Cedarhurst (Gray)
Population: 44.2% White, 30.9% Black, 15.7% Hispanic, 7.0% Asian, Deviation -96
Political: 63.0% Obama, 64.8% Dem, D+11, Safe D
Note that this riding reaches slightly into Queens, but it’s mainly a Long Island riding.
Thus, Long Island has 12 Democratic districts, 6 Republican districts, and 8 Swing districts. Combined with previous states, the tally is now 83-69-32, with 184 ridings described so far.
